testdat data with R

Karthik Ram

@_inundata


Forget big data, small data is the real revolution
- Rufus Pollock


Motivation behind developing the package

Data checking should be something that you do all the time, but it’s normally painful and boring.


Motivation behind developing the package

Most of data science is really cleaning and munging messy data - most data scientists I know


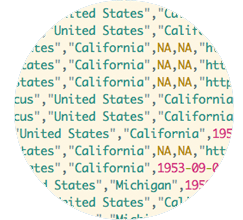
testdat is a programmatic implementation similar to Google/open refine


What testdat does


Allows you to describe what you expect data to look like, including catching errors [missing values, missing data, bad encoding], warnings [outliers and human errors]


What testdat does


Provides a way to re-run tests automatically as input data change or new data are added.

Testing your tabular data files

Dates
Mssing values
Outliers
Spatial bounds
Mangled strings (inconsistent capitalization, abbreviated names, pairs of elements with low distance)


library(testdat)
dat <- data.frame(
  date = rep(as.Date("2014-01-01"),10),
  num = c(1:8,999,"n/a"),
  name = c("NULL","naa",rep("foo",8))
)

dat
→           date num name
→  1  2014-01-01   1 NULL
→  2  2014-01-01   2  naa
→  3  2014-01-01   3  foo
→  4  2014-01-01   4  foo
→  5  2014-01-01   5  foo
→  6  2014-01-01   6  foo
→  7  2014-01-01   7  foo
→  8  2014-01-01   8  foo
→  9  2014-01-01 999  foo
→  10 2014-01-01 n/a  foo
find_NA(dat)
→    row column value
→  1   9      2   999
→  2  10      2   n/a
→  3   1      3  NULL


find_NA(dat)
→    row column value
→  1   9      2   999
→  2  10      2   n/a
→  3   1      3  NULL
class(dat$num)
→  [1] "character"
clean_dat <- fix_NA(dat, custom_NAs = "naa")
clean_dat
→           date num name
→  1  2014-01-01   1 
→  2  2014-01-01   2 
→  3  2014-01-01   3  foo
→  4  2014-01-01   4  foo
→  5  2014-01-01   5  foo
→  6  2014-01-01   6  foo
→  7  2014-01-01   7  foo
→  8  2014-01-01   8  foo
→  9  2014-01-01  NA  foo
→  10 2014-01-01  NA  foo
class(clean_dat$num)
→  [1] "numeric"

Setting up a test
test-all.R

context("checking for NAs")

test_that("data dont contain NAs", {
data_files <- lapply(dir(pattern = "*.csv"), read.csv)
na_check <- sapply(data_files, test_NA)
expect_true(all(na_check))
})


Browse the results of unit tests with lens

Fostering
open science with R


An article about [computational] science in a scientific publication is not the scholarship itself, it is merely advertising of the scholarship. The actual scholarship is the complete set of instructions [and data] which generated the figures.

- David Donoho (Stanford University)

The way we do science is also changing

The four pillars of scientific practice

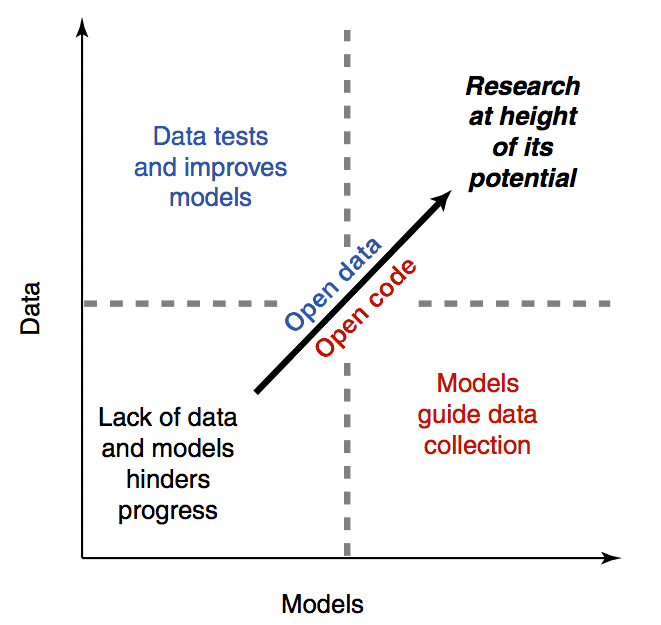
Experimentation, theory, computing, data-intensive


How and where these data were obtained is often a black box


Data and computer code should be made available at an early stage
Article

Open data + code

Source: Wolkovich et al. Global Change Biology, 2012.


Enable access to scientific data repositories, full-text of articles, and science metrics and also facilitate a culture shift in the scientific community.


More info @ ropensci.org/packages

      
 Data
Treebase 
Fishbase
GBIF
Dryad

      
  Journals
PLOS
Springer
Mendeley
textmine
pensoft
      
 Data Viz
rMaps
plot.ly

      
  Data Publication figshare
git2r
rdat
DataONE 
rAltmetric
EML

Access to a variety of scientific data

400+ million observation records
Full text 100k articles
Data from papers in > 200 journals


Accessing data from papers - rdryad

library(rdryad)
library(dplyr)
data <- download_url("10255/dryad.1759") %>% dryad_getfile
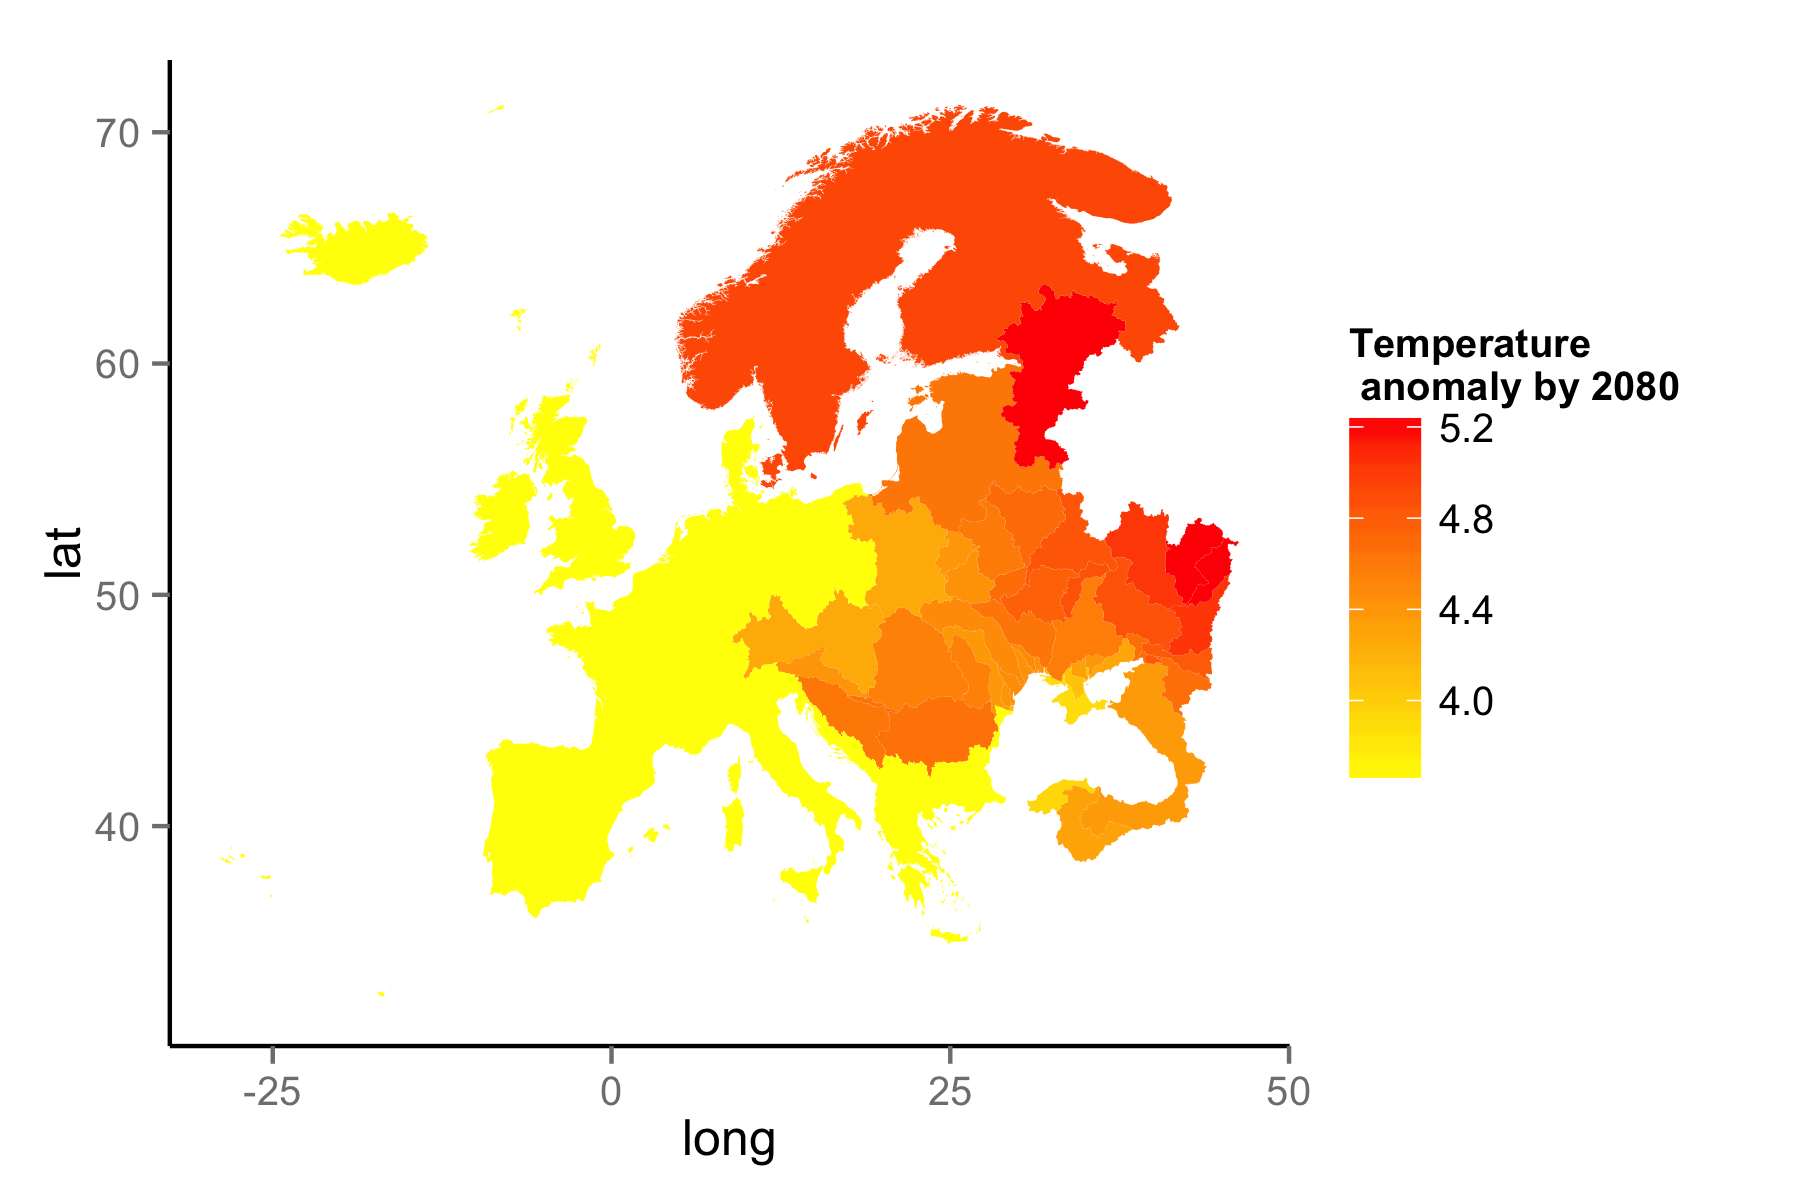
Dataset

50+ years of fisheries data

library(rfisheries)
library(dplyr)
who <- c("TUX", "COD", "VET", "NPA")
# Four well known commercial fisheries
species_data <- function(x) of_landings(species = x)
who %>% lapply(., species_data) %>% rbind_all

World Bank climate portal rWBclimate

library(rWBclimate)
eu_basin <- create_map_df(Eur_basin)
eu_basin_dat <- get_ensemble_temp(Eur_basin, "annualanom", 2080, 2100)

Data Viz

Interactively visualize and analyze data


Taxon specific databases - AntWeb

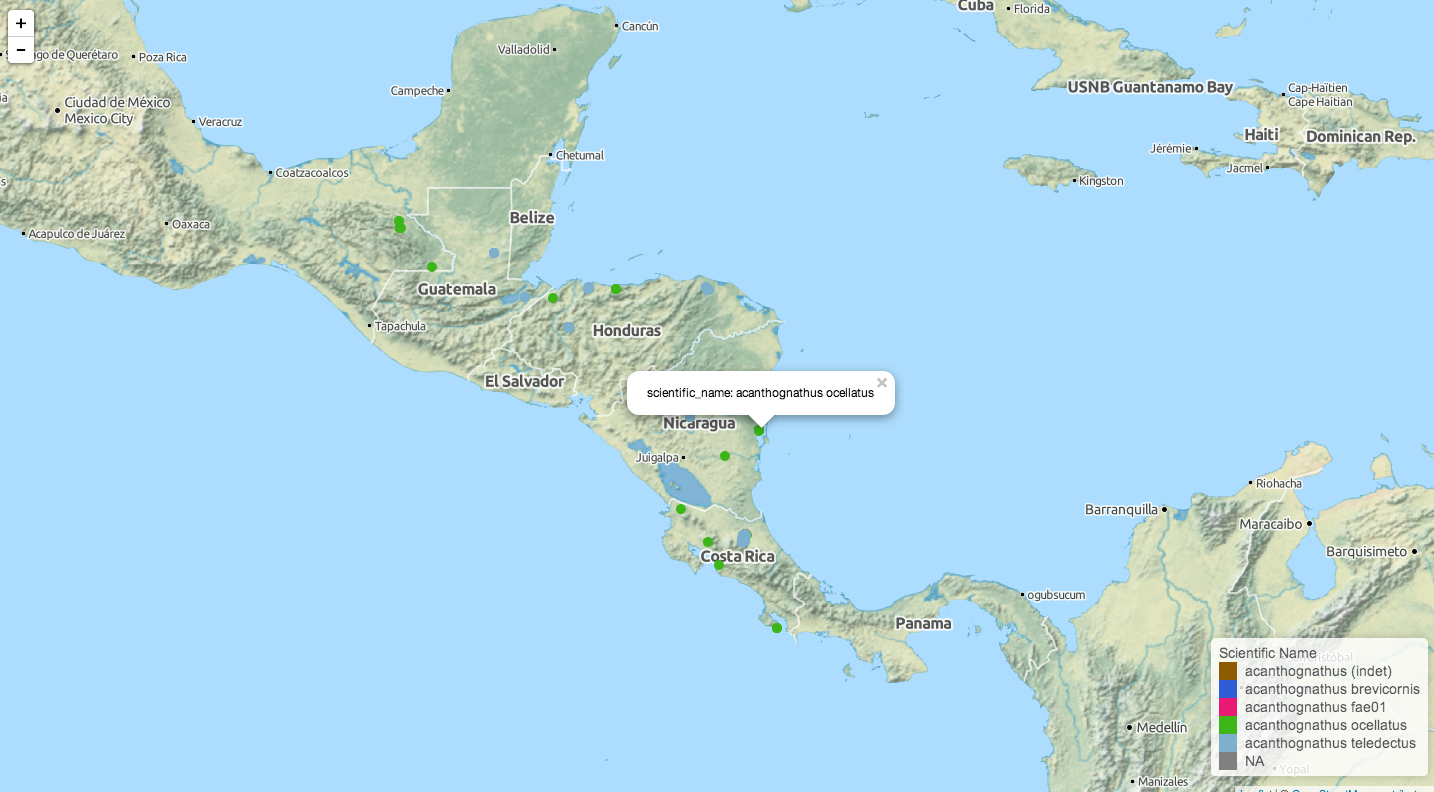
library(AntWeb); library(dplyr)
aw_data(genus = "acanthognathus") %>% aw_map

Interactive figures - plotly


Interactive figures - plotly


Document and upload your data

Easily deposit data alongside analysis


Sharing data - (rfigshare)

Using figshare's API it is possible to share figures, data and any other objects generated in R and obtain a data citation.


library(rfigshare)
id <- fs_create("Fisheries dataset", "A dataset containing catch for 4 important commercial fish species","dataset")
fs_upload(id, "dat.csv")


The scientific workflow


The scientific workflow


Made possible by generous support from

ropensci.org


karthik.github.io/testdat-talk

Type M for and G to go to specific slide

/